


In a world where debt has swollen far beyond historical precedent, the gold/S&P ratio becomes more than a chart — it is a stress indicator of the system itself. As liabilities expand toward quadrillions, equity markets depend increasingly on liquidity rather than fundamentals, while gold quietly reasserts its monetary role.

The rising ratio does not celebrate gold’s strength; it reflects the gradual erosion of confidence in paper assets. If this trend continues, what we are witnessing may be less a market cycle and more a structural shift in how wealth is measured and preserved.
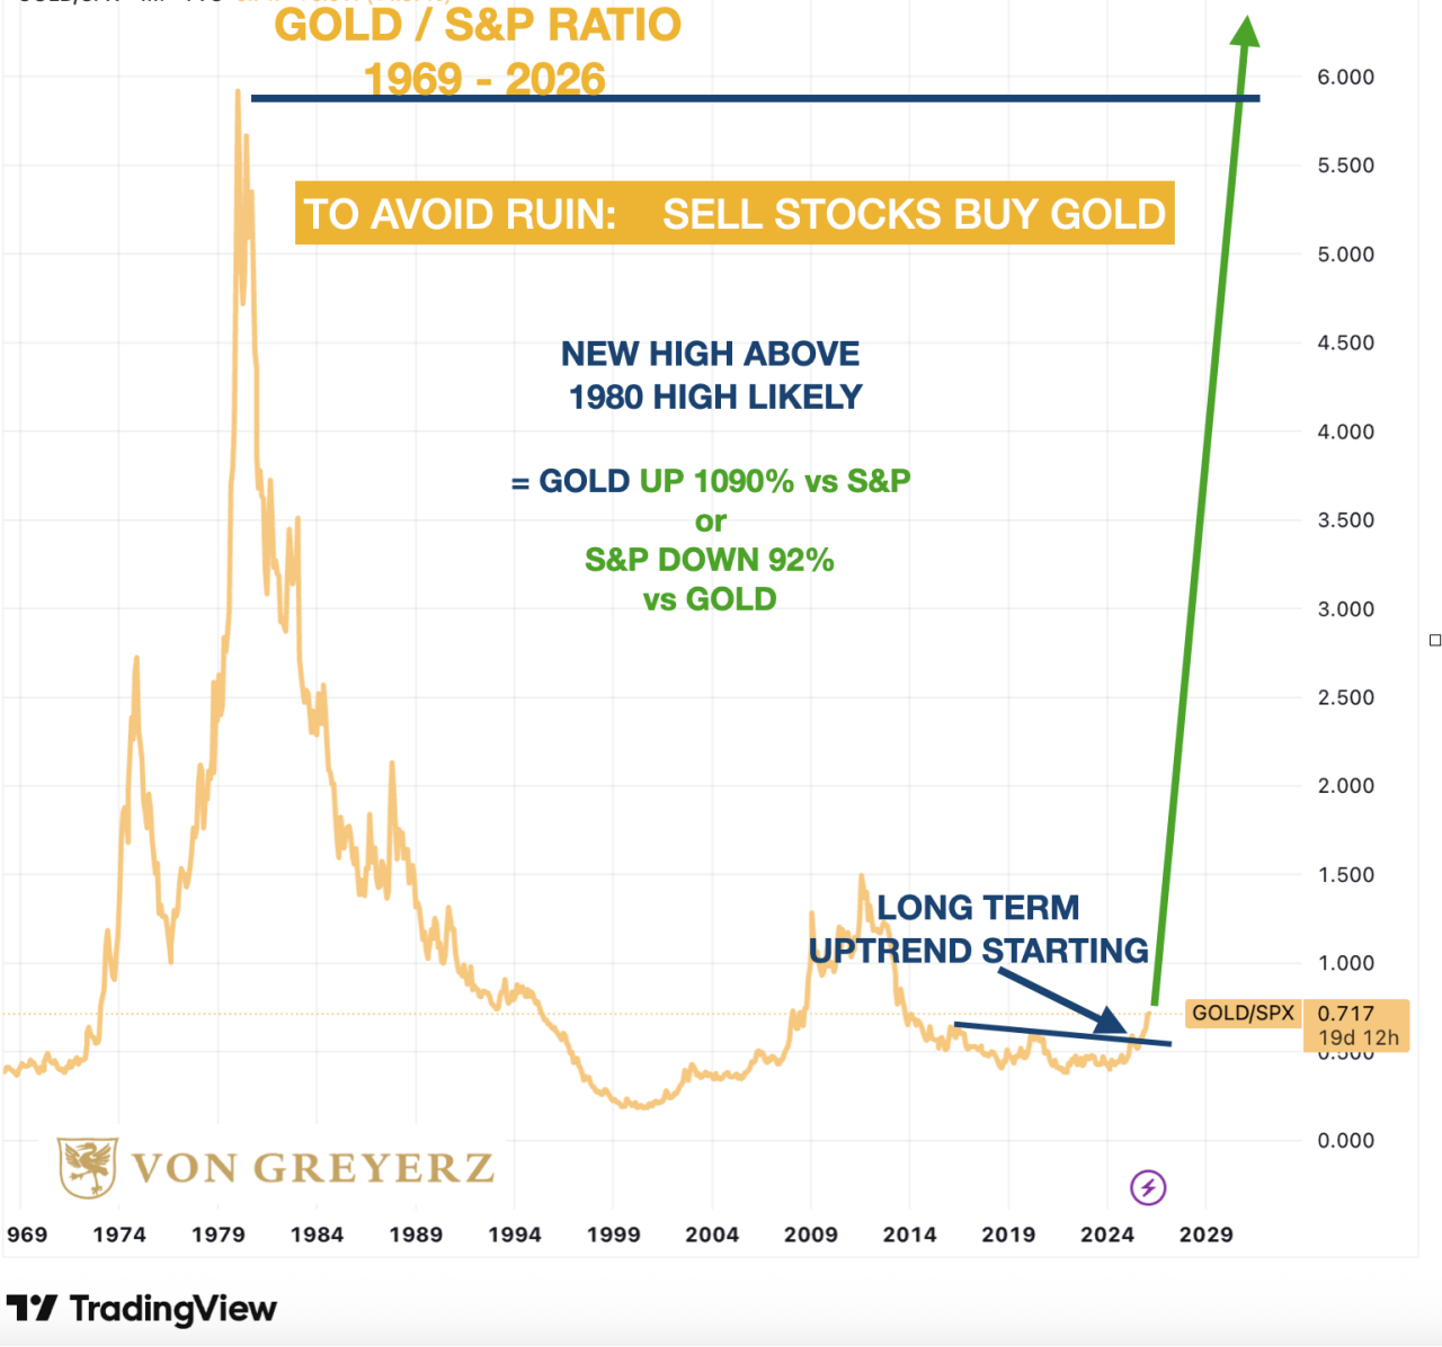
In a world of quadrillion debt, this ratio tells the truth.
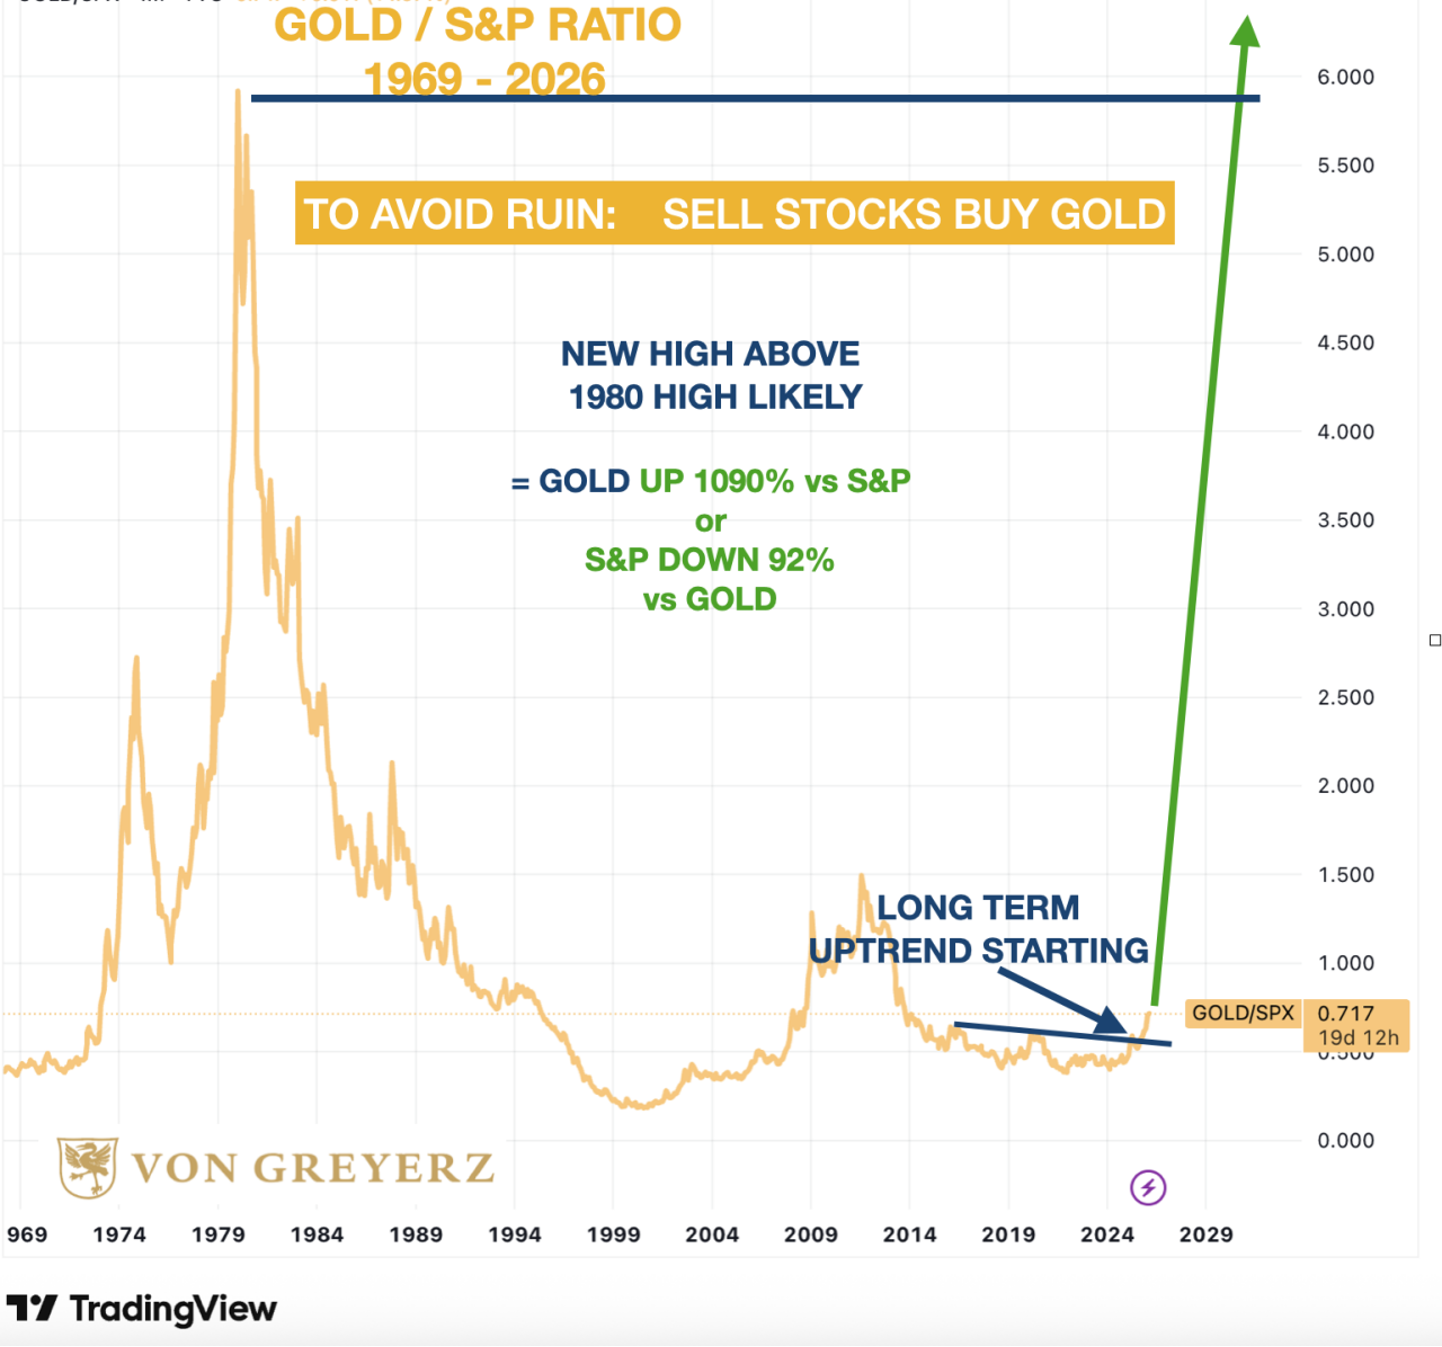
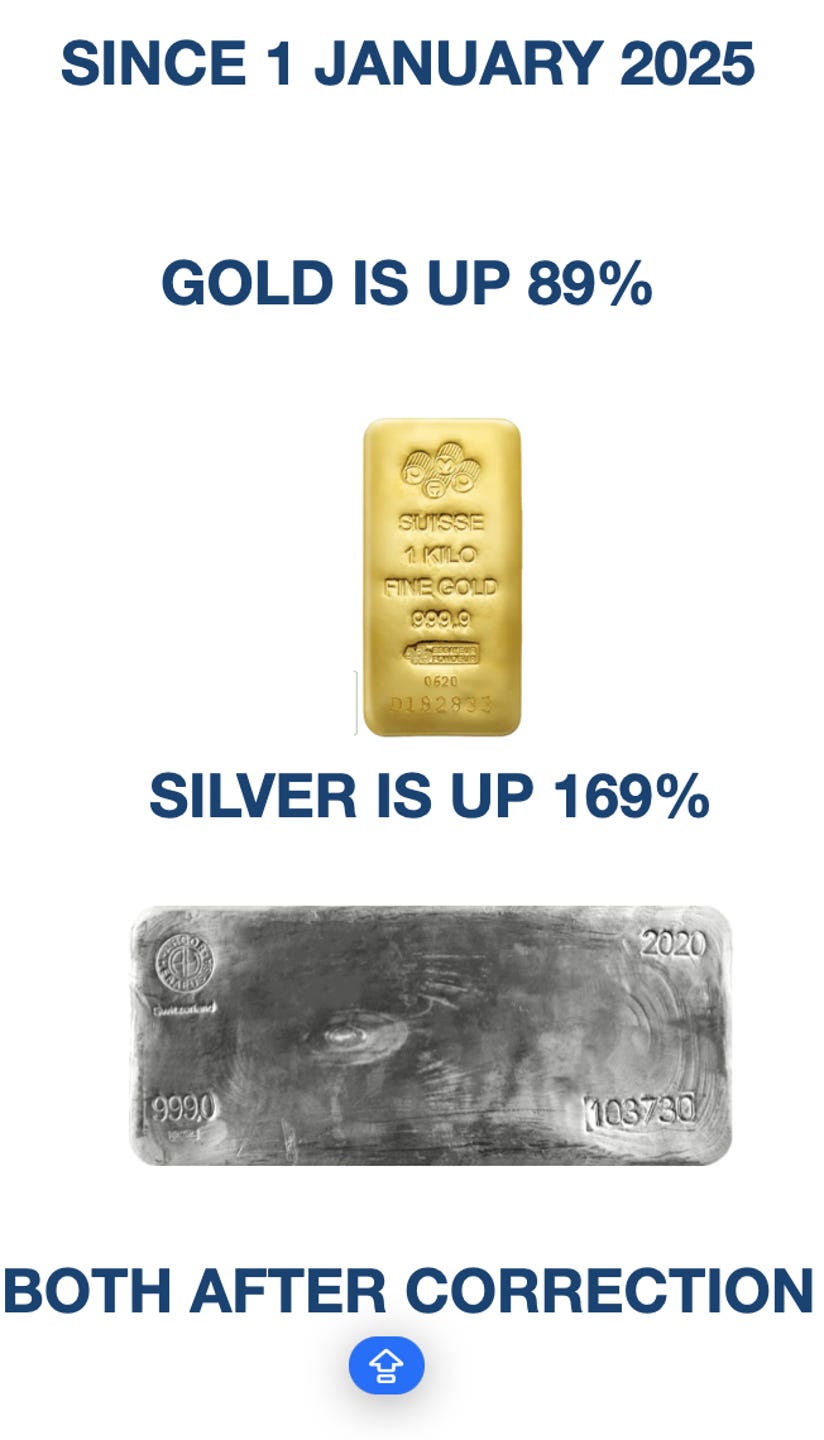
Even after the correction, gold and silver remain sharply higher since January 2025. That resilience signals a structural shift, not a temporary trade. Real value is moving from paper promises to physical assets.
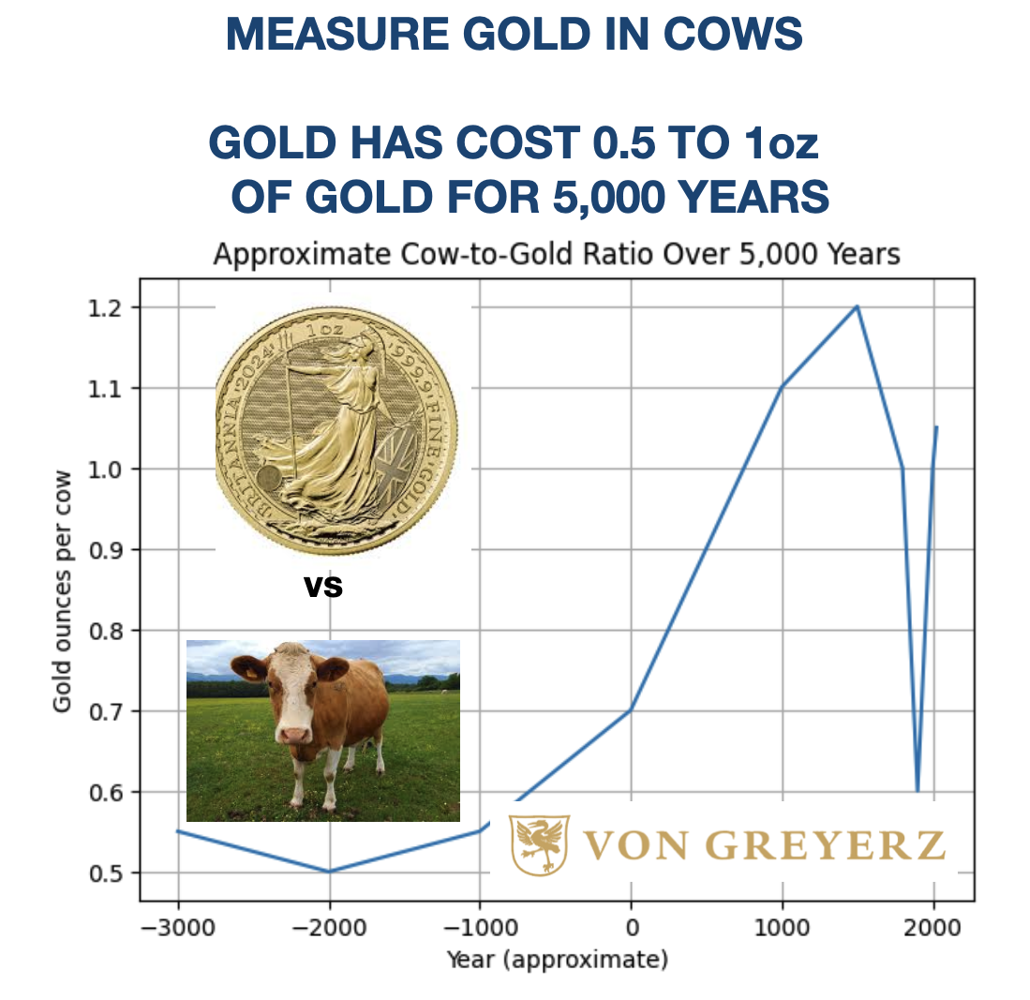
For roughly 5,000 years, about half to one ounce of gold has consistently represented the value of a cow. That remarkable stability reflects gold’s role as a measure of real economic worth across civilizations, currencies, and monetary regimes.
Unlike today’s volatile financial ratios, this continuity shows that when systems shift or fail, gold remains anchored to tangible value. Currencies and markets drift, but gold continually pulls them back toward economic reality.
KEY INSIGHTS:
00:00 – 03:05 | Correction = Opportunity, Not Danger
Gold (+86%) and silver (+155%) since Jan 2025 are in a powerful bull market; recent pullbacks are normal. Investors should measure wealth in ounces, not currencies as fiat money is being debased.
03:06 – 06:14 | Paper Markets vs Physical Reality
COMEX circuit breakers and margin mechanics reveal how paper prices are gamed. Hedge funds can still manipulate short-term moves, but physical metal — especially silver — is tightening.
06:15 – 08:00 | London Is No Longer a True Physical Market
LBMA has become largely paper-based, with over 2 billion ounces of silver claims versus limited deliverable metal. Delivery risk is rising as physical demand strengthens.
08:00 – 09:20 | Why Silver Matters More
Silver faces deeper structural deficits than gold, making it more volatile — but far more explosive to the upside in a tightening physical market.
09:20 – 10:20 | Price Outlook: Gold $10,000, Silver $666–$1,000
Gold is likely to move toward $10,000. At historical ratios, silver would be at least ~$666 and could approach $1,000 or higher.
10:20 – End | The Big Picture
Corrections will continue, but the next move is likely much larger. As trust in paper markets erodes, liquidity may vanish — making metal harder to obtain.
One day there will be no offer — only a bid.


