


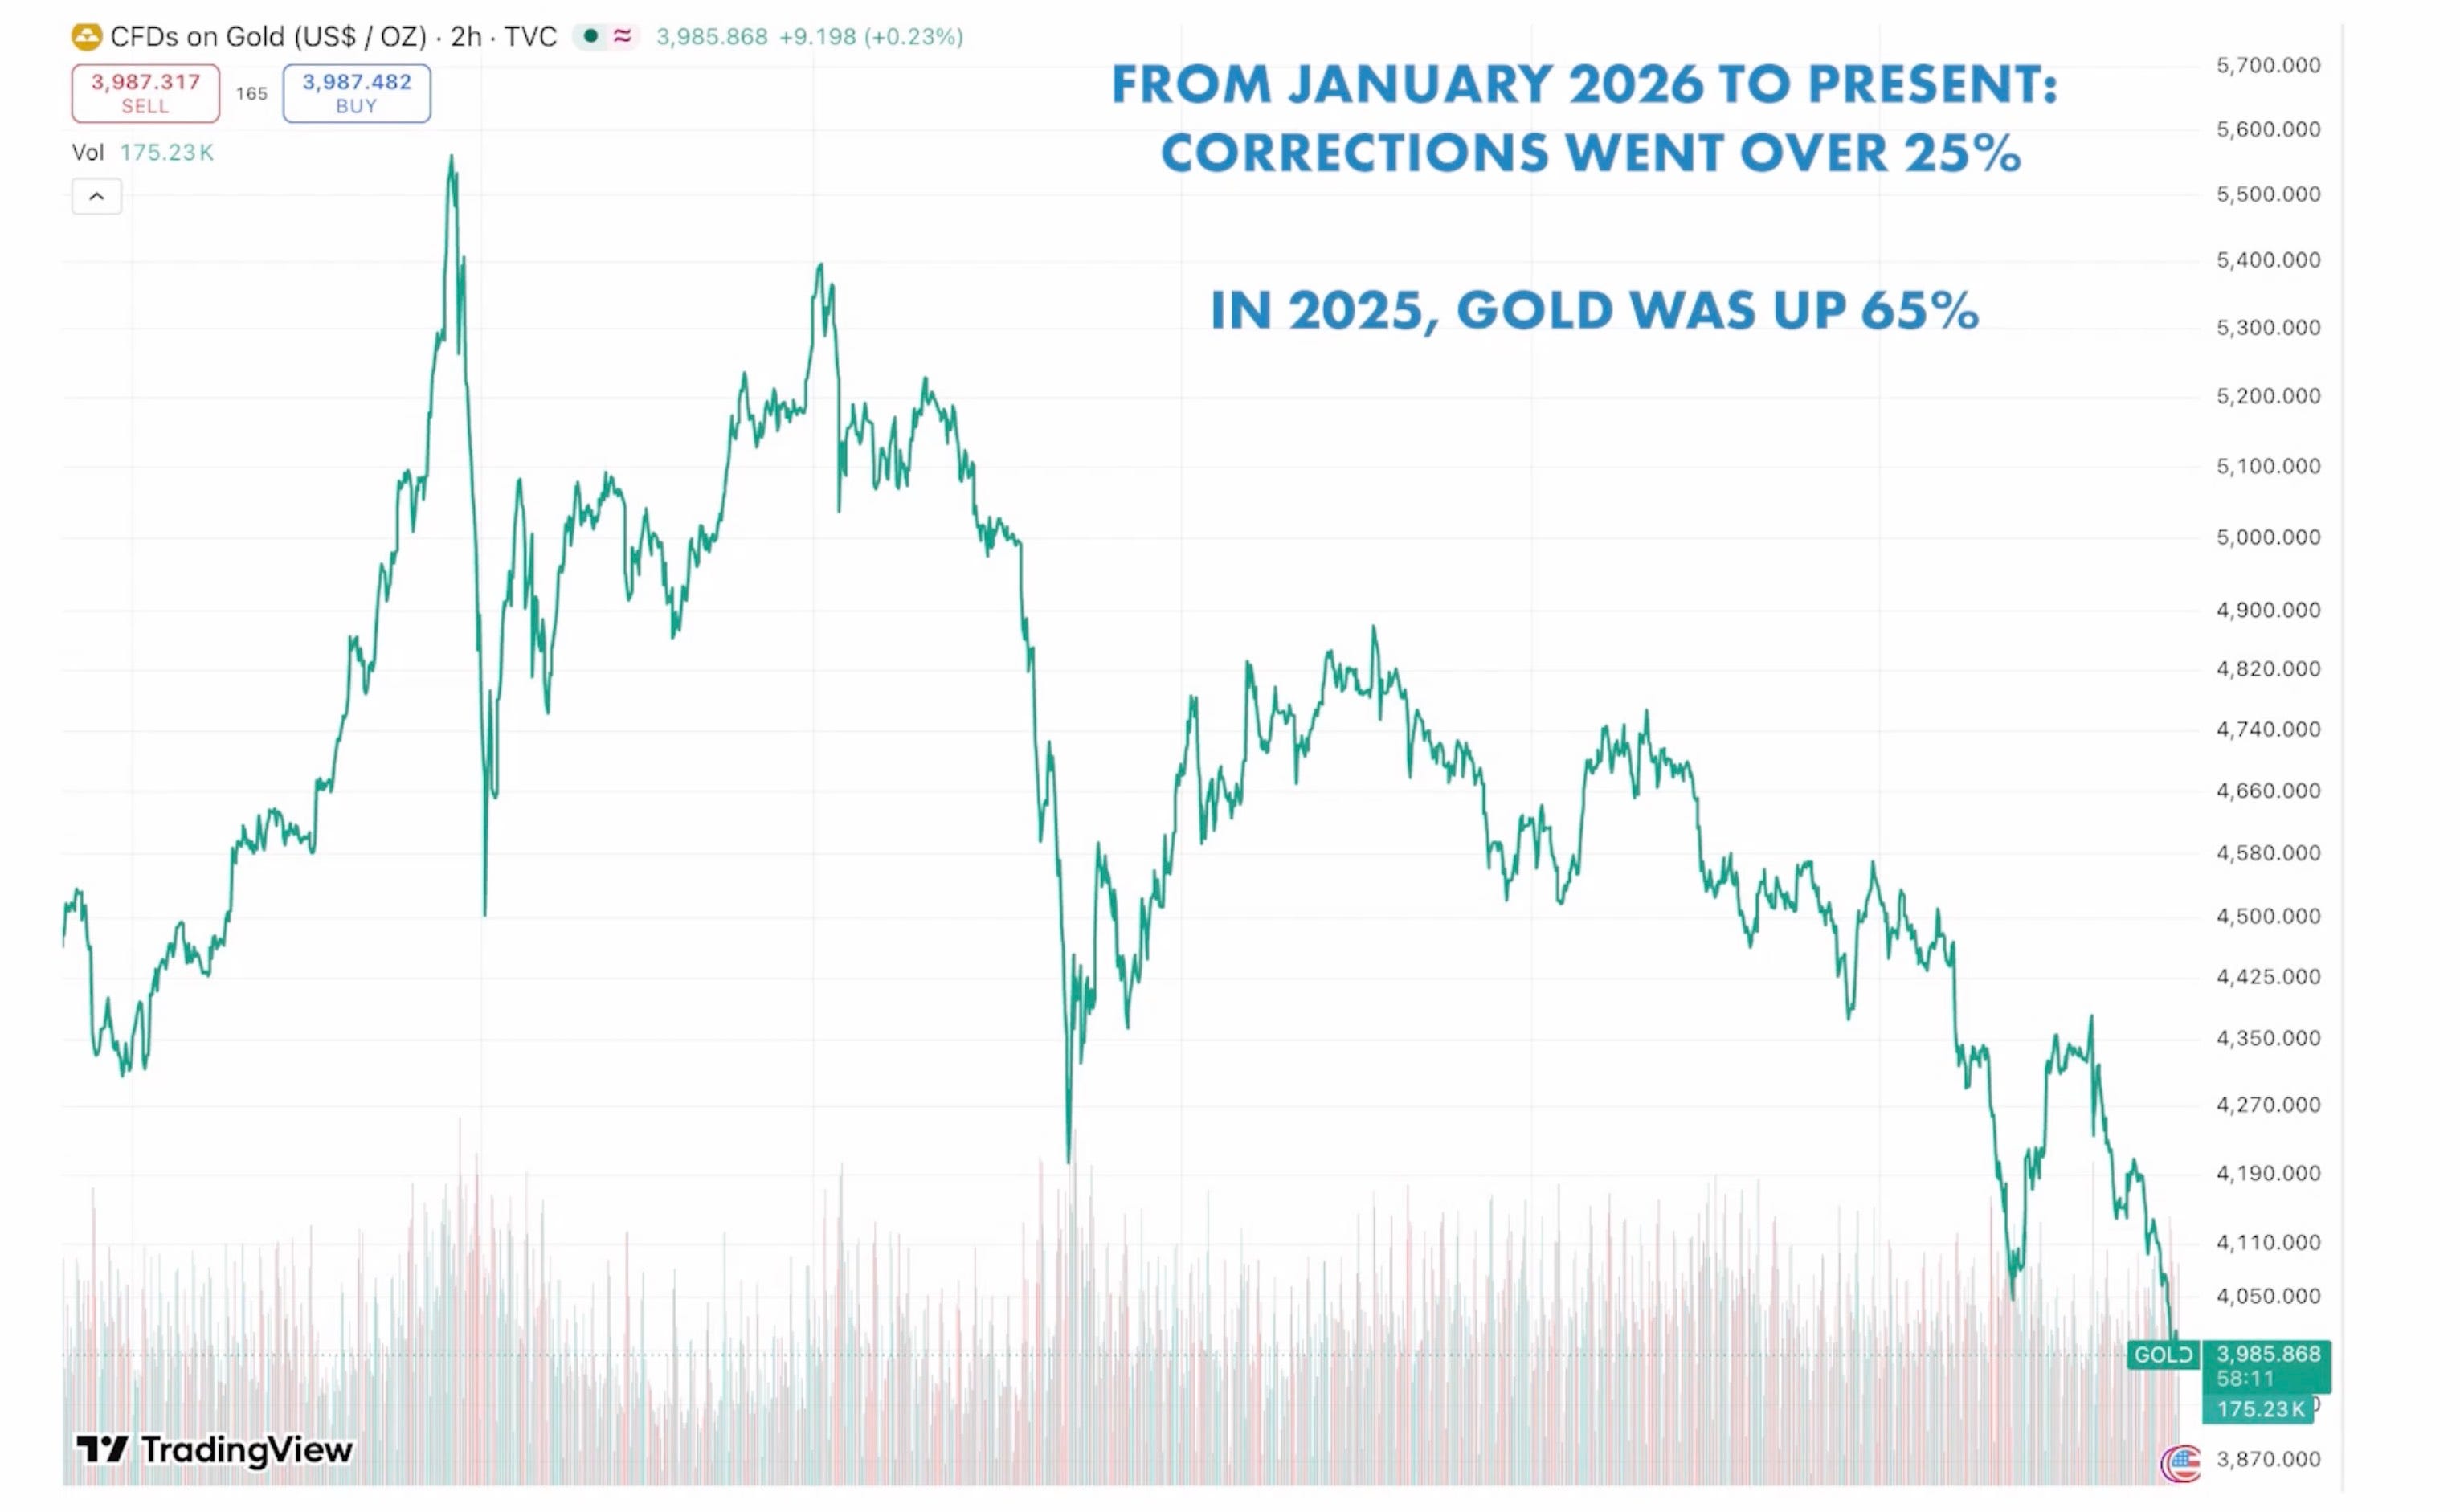
For most investors, a 25% correction in the gold price is unsettling. It’s well beyond what many would consider a normal pullback, and enough to make some wonder whether the bull market has already run its course.
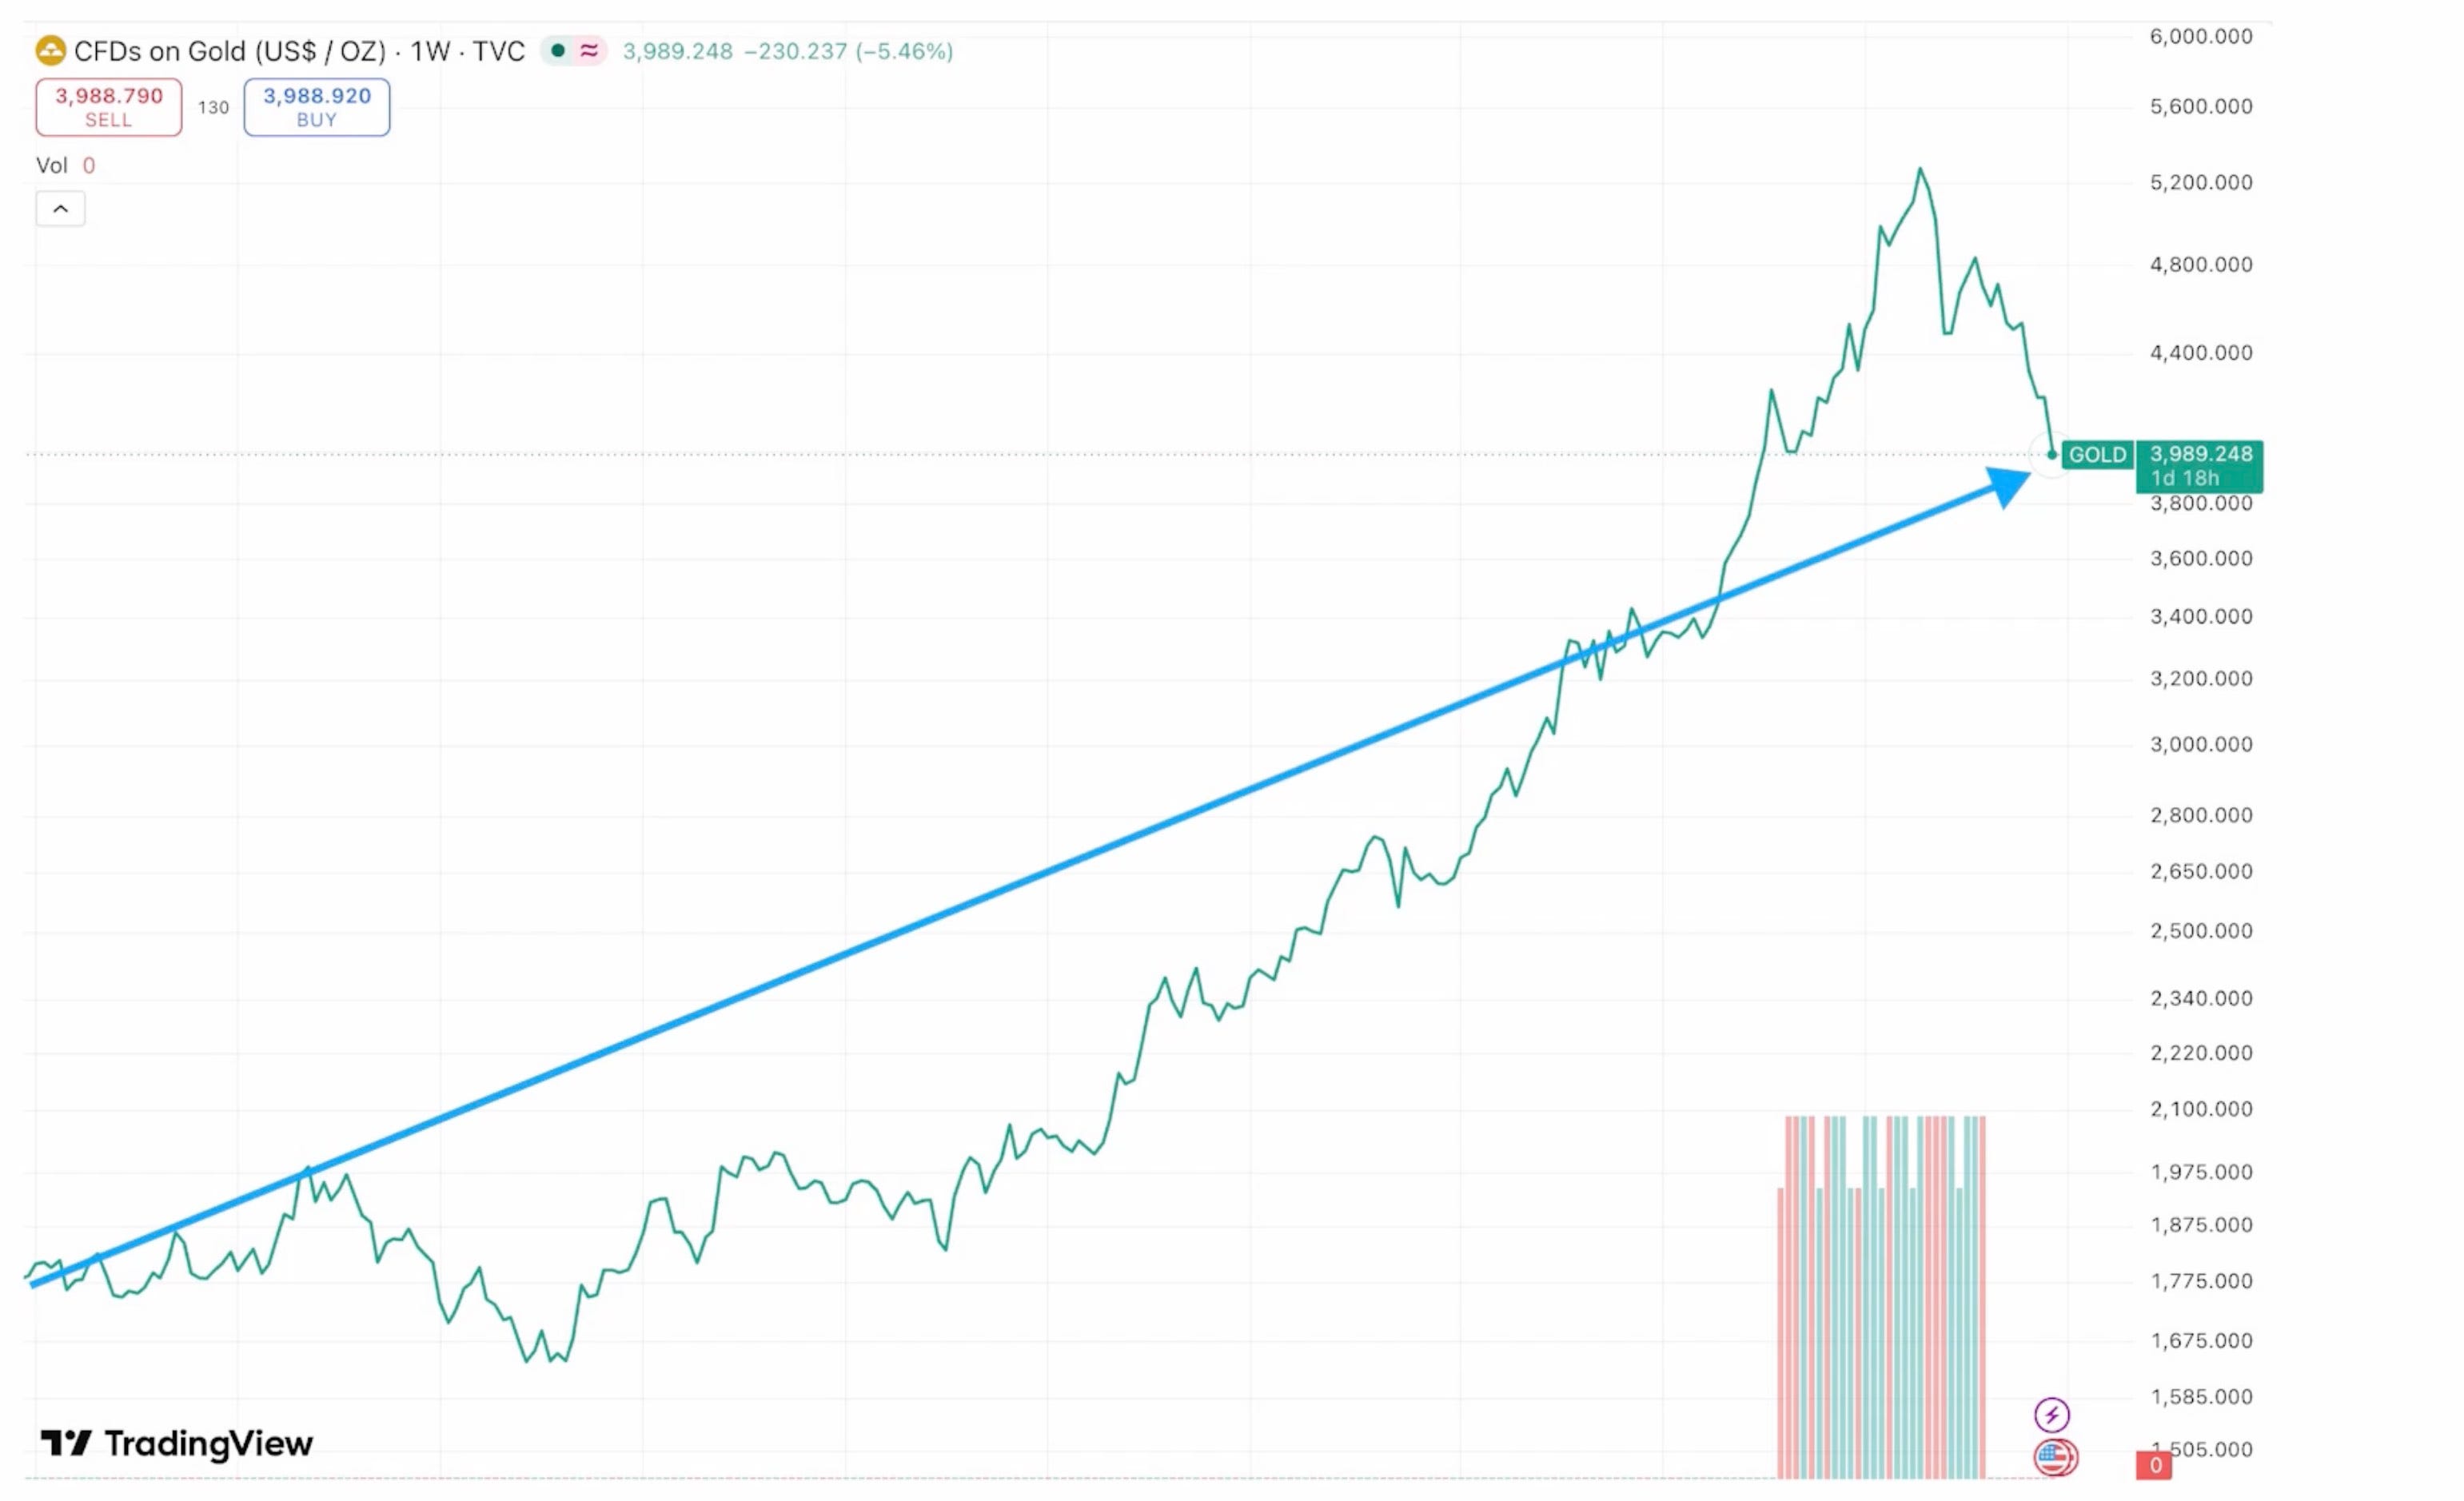
But gold has never moved in a straight line. Every major bull market has included periods where prices fell sharply before recovering.
Gold rose 65% during 2025, one of its strongest annual performances in decades. Over the past five years, it has gained 128%.
Seen in that context, the recent decline looks very different.
History points in the same direction.
During the inflationary bull market of the 1970s, gold experienced five corrections of more than 20%. Between 1974 and 1976, the price fell by roughly half before going on to rise sevenfold into its 1980 peak.
Those corrections were part of the bull market, not the end of it.
Short-term price movements often reflect changing expectations around interest rates and the U.S. dollar. The recent correction has coincided with a stronger dollar and higher real interest rates, both of which have historically weighed on gold prices.
Periods of higher real rates have also appeared near major peaks in equity markets. In 2000, rising real rates coincided with the collapse of the technology bubble.
Today’s stock market is again heavily concentrated in a small number of companies, raising questions about how long current valuations can be sustained.
Meanwhile, central banks continue adding gold to their reserves.
Although a handful of countries reportedly sold gold during the Iran conflict to raise liquidity, overall central bank demand remains intact. Gold holdings now exceed their holdings of U.S. Treasuries.
The broader backdrop has changed very little.
Government debt continues to grow, inflation remains persistent, and highly indebted governments have limited room to tolerate higher borrowing costs.
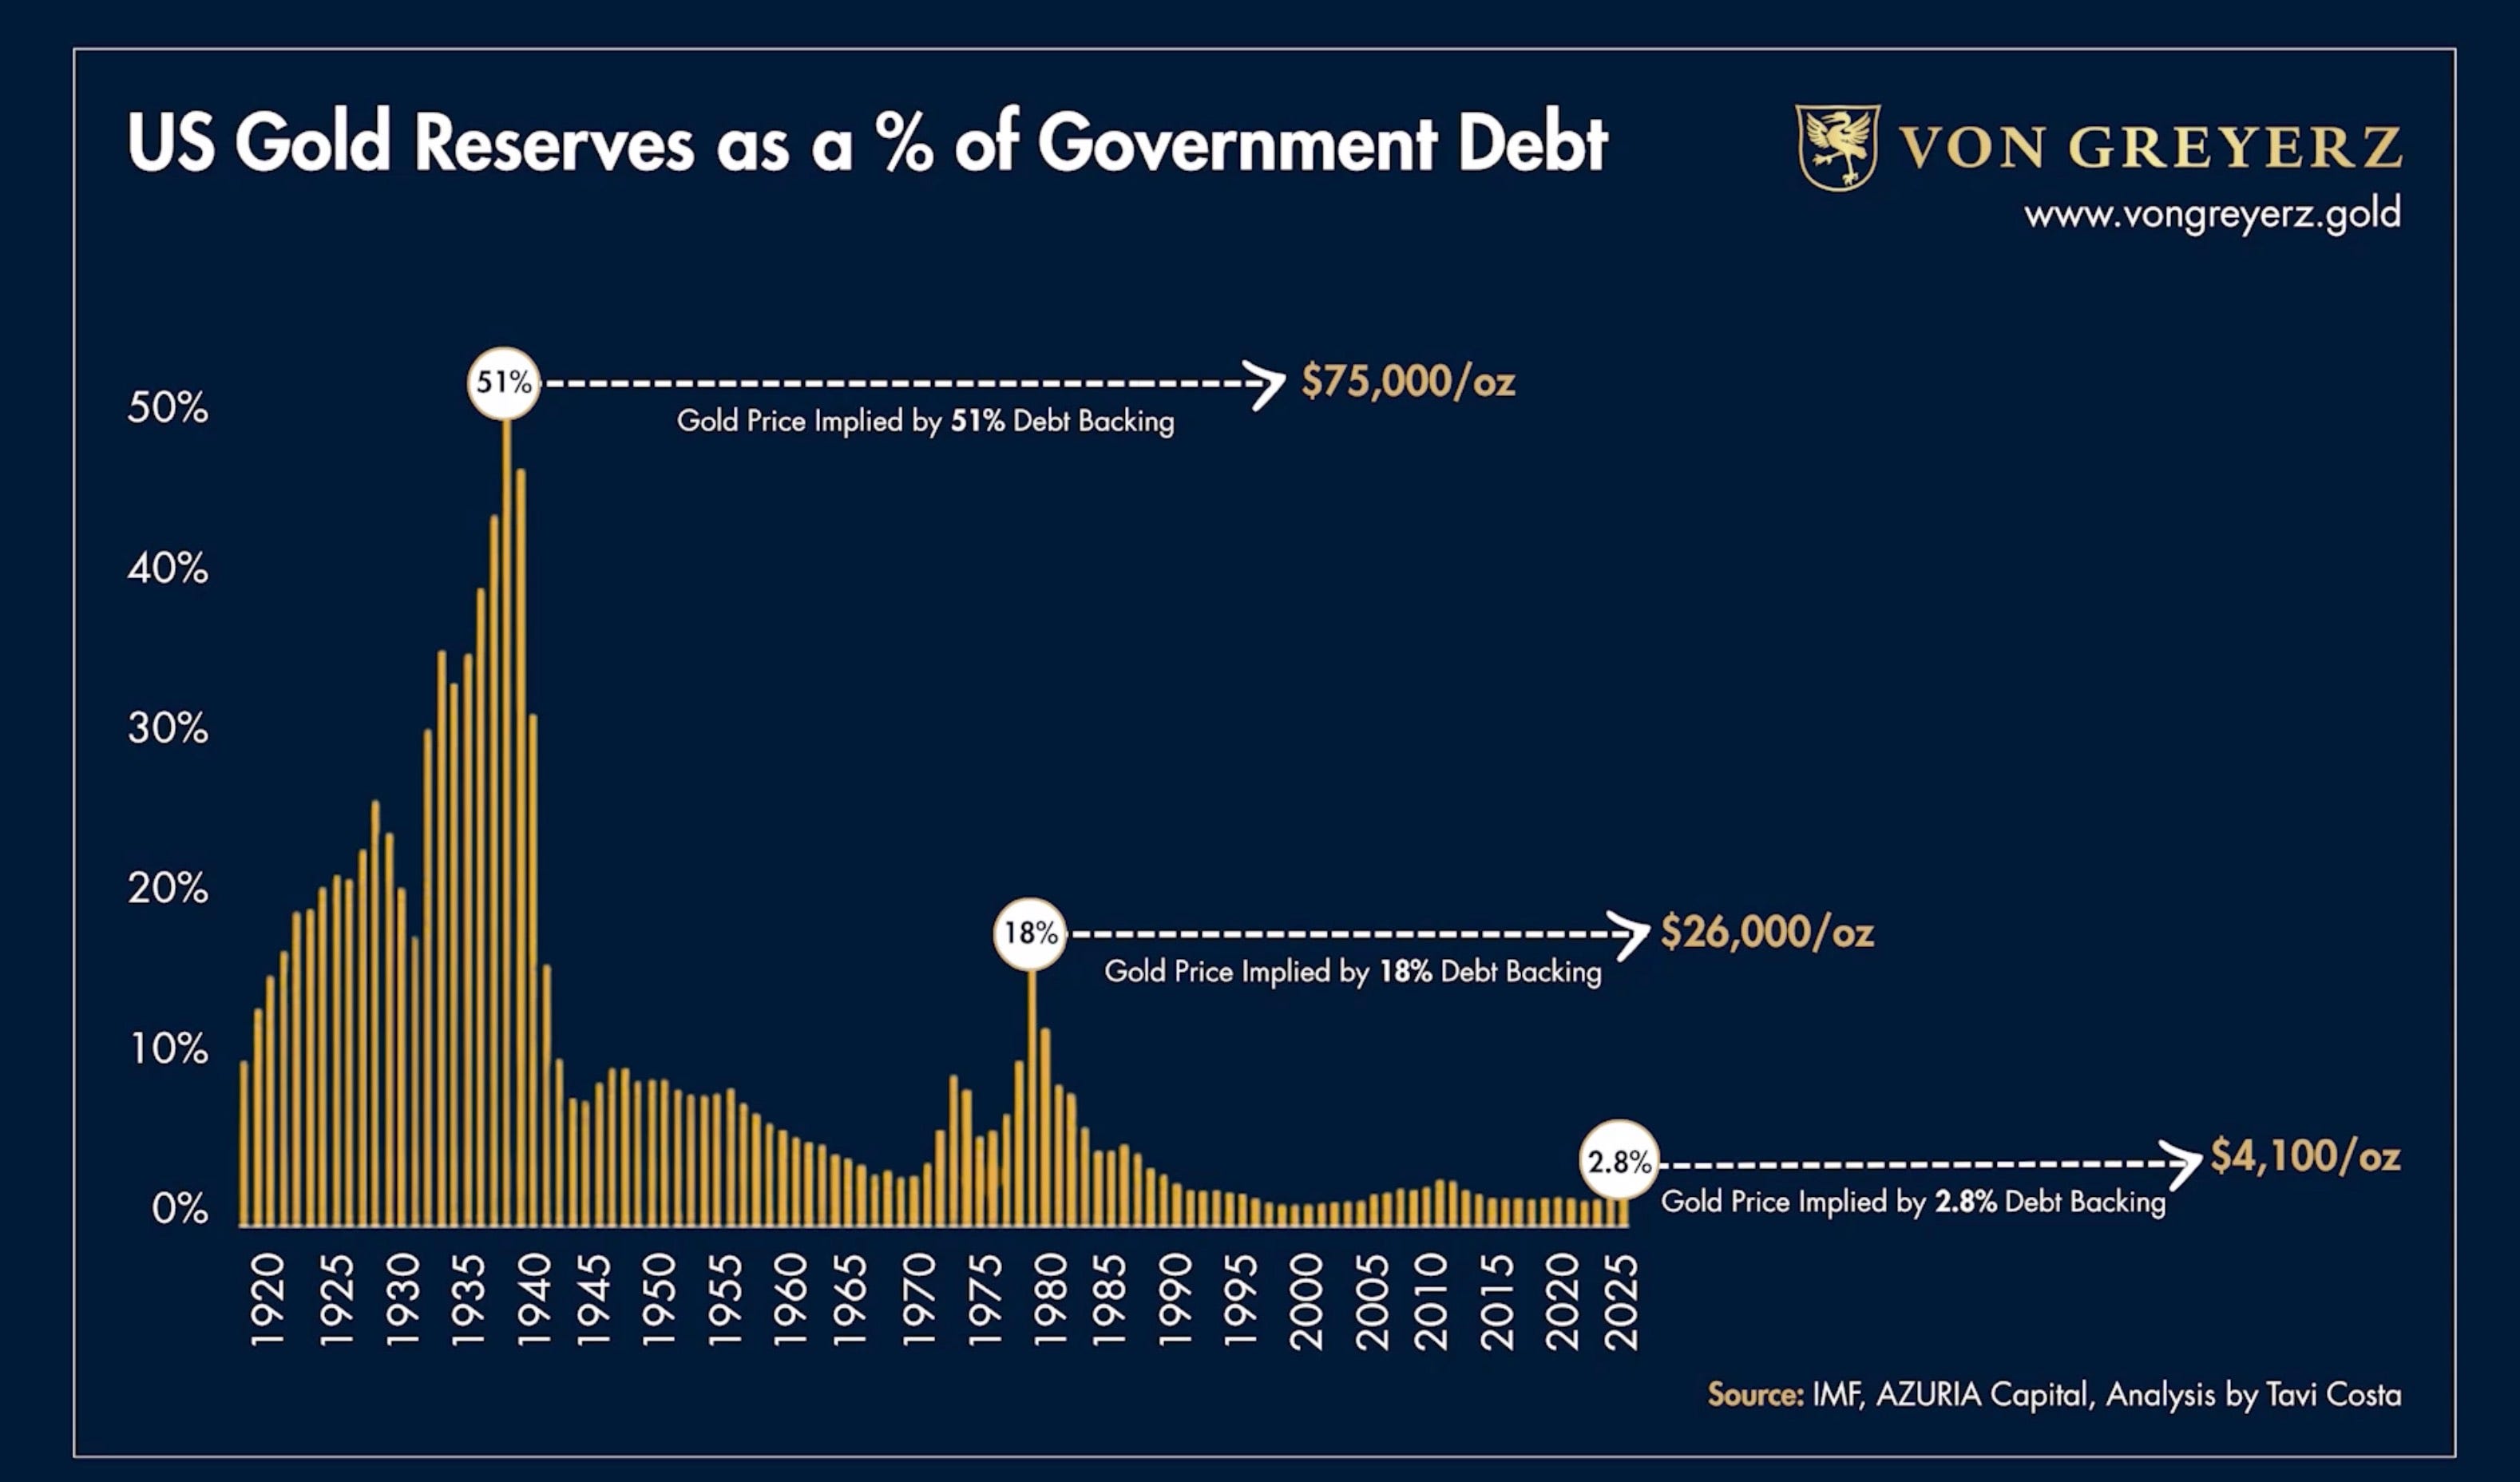
One way to view that imbalance is through the relationship between U.S. gold reserves and government debt.
During the Second World War, the value of U.S. gold reserves represented about 51% of the federal debt. By 1980, that figure had fallen to around 18%.
Today, it is approximately 2.8%.
If gold represented the same share of federal debt that it did in 1980, the implied price would be roughly $26,000 per ounce. Matching the Second World War level would imply around $75,000 per ounce.
The purpose of the comparison is not to predict a future gold price.
It illustrates how rapidly debt has expanded relative to the nation’s gold reserves.
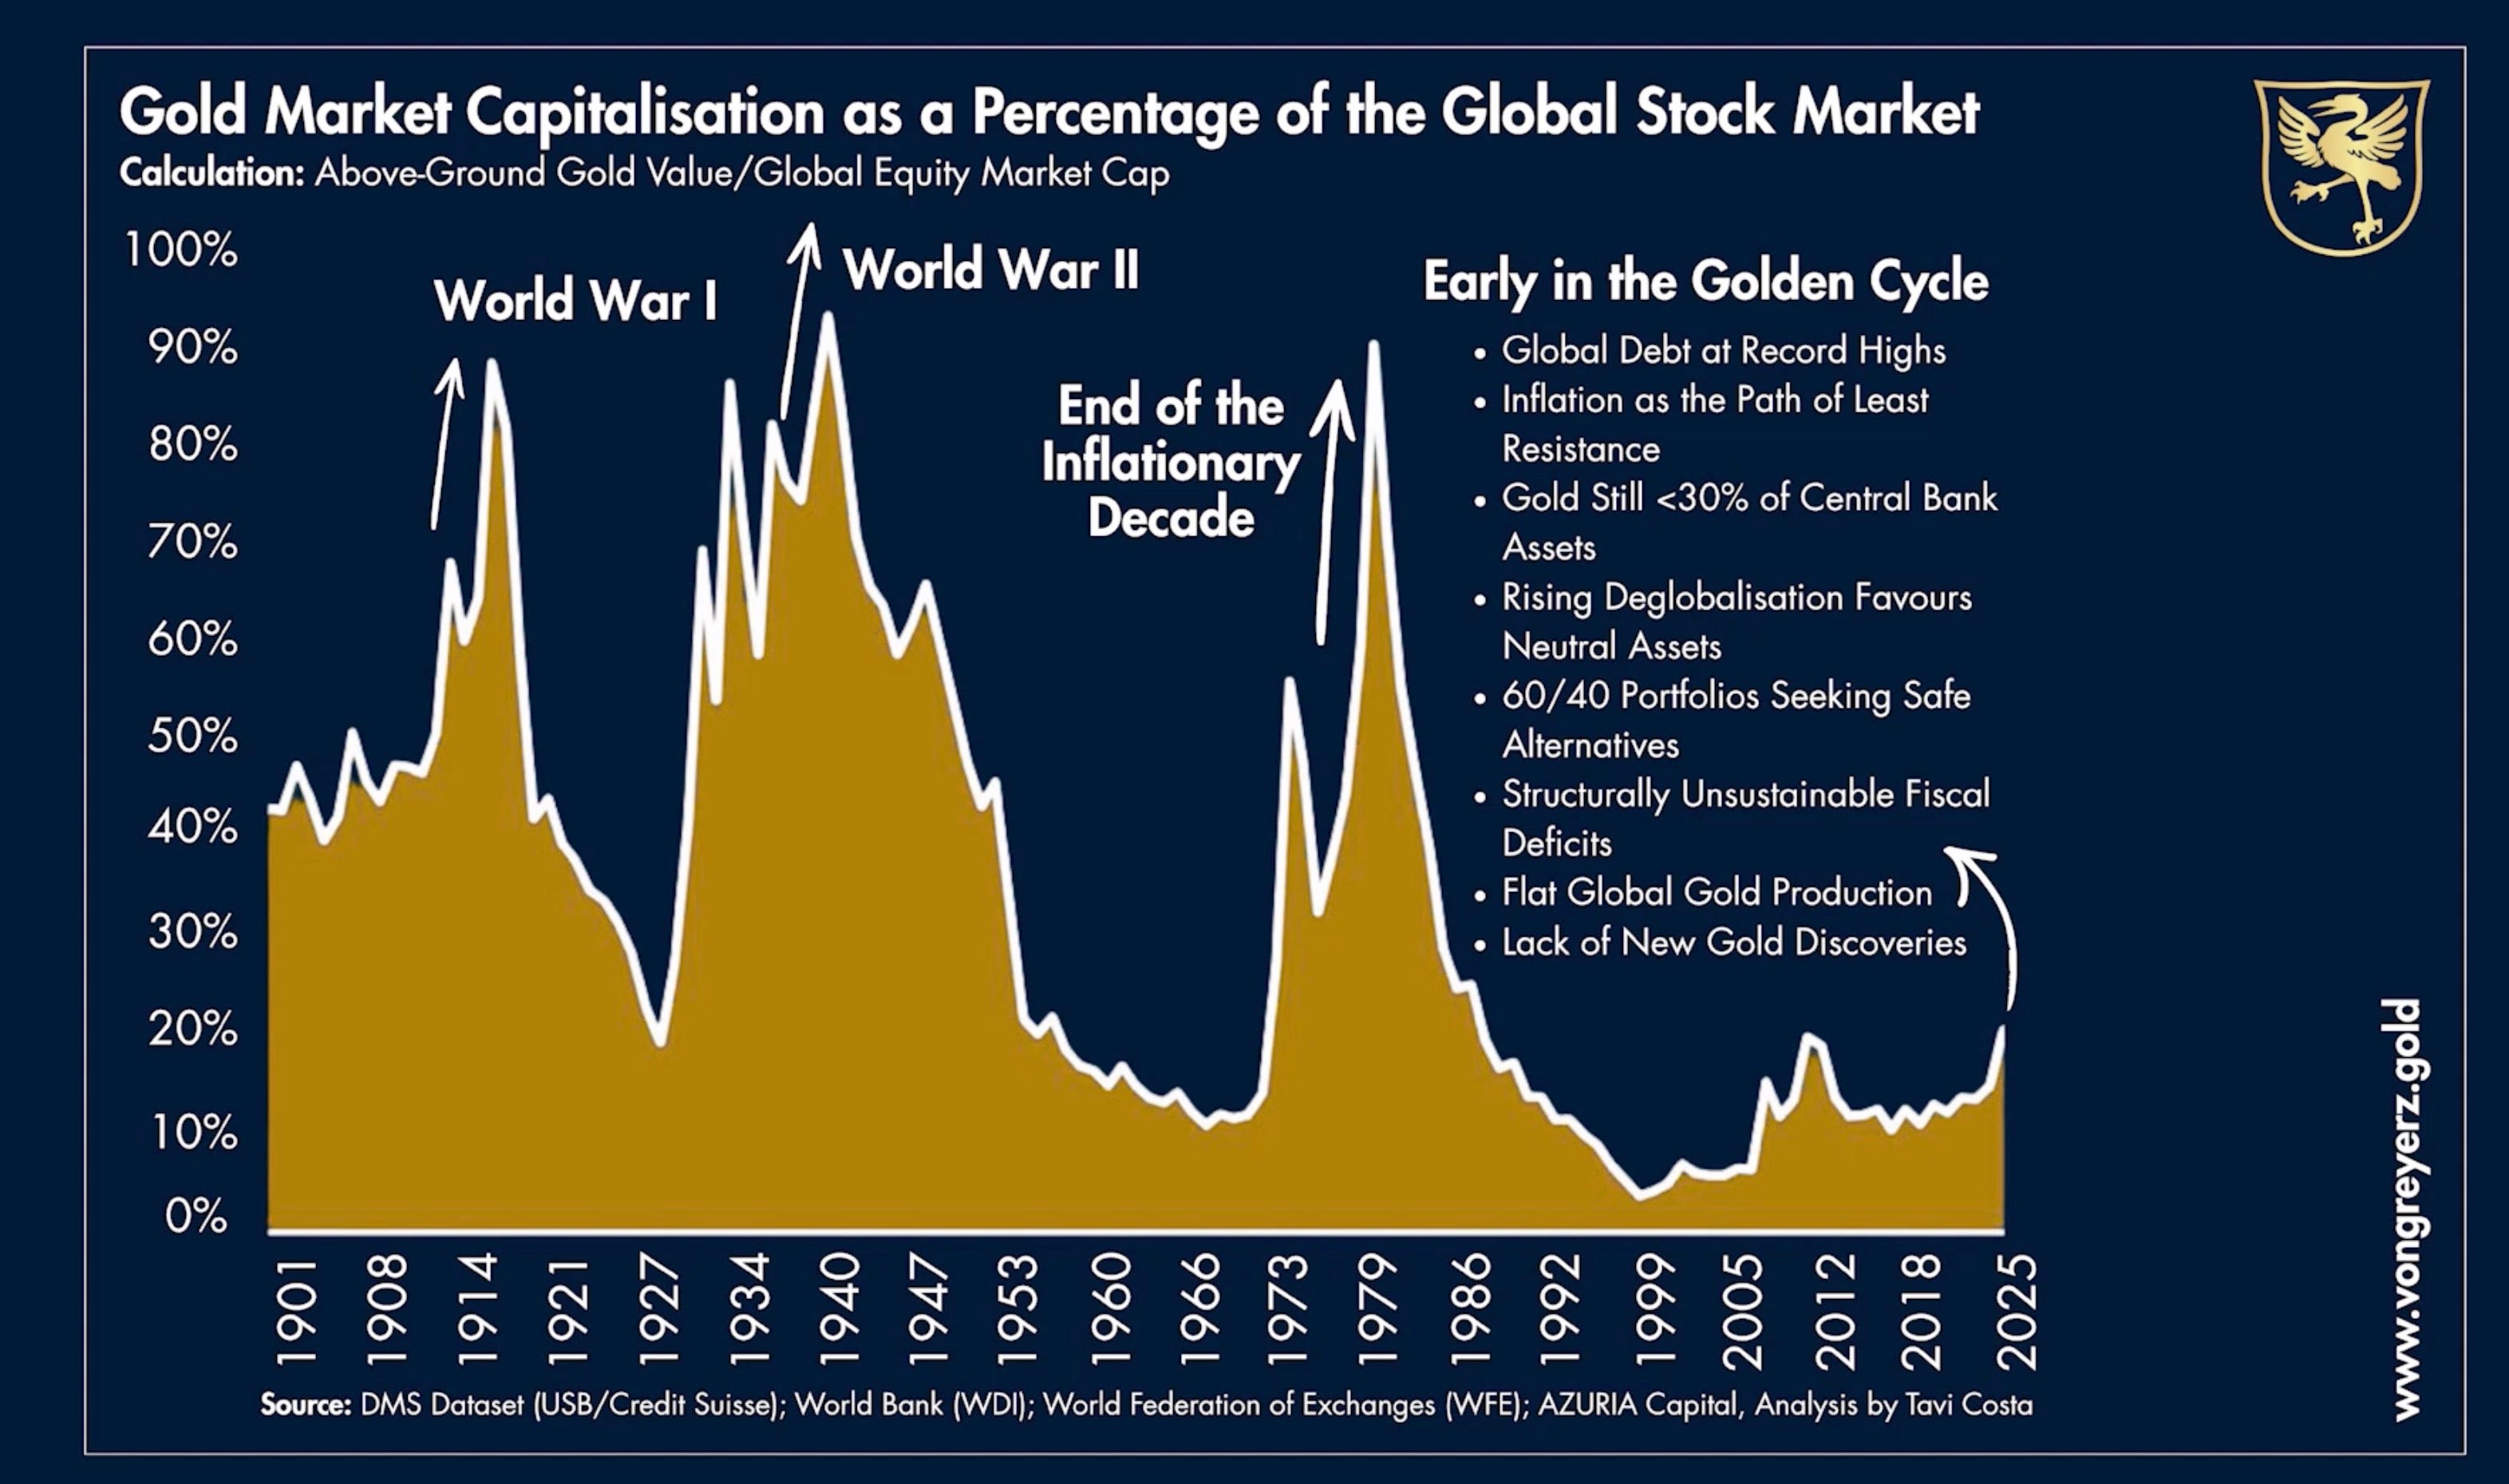
The same pattern appears when comparing gold with global equity markets.
The value of all above-ground gold currently represents about 18% of the total global stock market capitalization.
Over the past 120 years, that figure has averaged closer to 40%.
Returning to that long-term average would imply a substantially higher gold price than today’s level.
Corrections are part of every long-term bull market.
What tends to matter more is whether the forces behind that market have changed.
Debt levels continue to rise across the world’s largest economies. Inflation has proven difficult to bring back to target, and governments carrying record debt burdens have limited options if borrowing costs remain elevated.
History shows that heavily indebted governments eventually choose lower interest rates and more money creation over allowing debt servicing costs to spiral higher.
That process may support asset prices in nominal terms, but it comes at the expense of the purchasing power of paper currencies.
The recent correction has changed the price of gold.
It has done little to change the conditions that have supported it for years.
KEY INSIGHTS
00:00 – 01:31 | Putting the 25% correction into perspective
Gold’s recent pullback, long-term performance, and how previous bull markets have experienced similar corrections.
01:32 – 02:38 | Why gold corrected
A stronger dollar, higher real interest rates, stock market concentration, and continued central bank buying.
02:39 – 04:20 | Gold versus government debt
How U.S. gold reserves compare with federal debt and what previous levels of debt backing imply.
04:21 – 05:06 | Gold versus global stock markets
Gold’s share of global equity market value compared with its long-term historical average.
05:07 – 05:37 | Corrections within secular bull markets
Historical drawdowns during the 1970s and why they did not end the long-term uptrend.
05:38 – 06:23 | Debt, money printing, and fiat currencies
Why heavily indebted governments resort to monetary expansion and what that means for paper currencies.


